Realtor.com Investor Report: Investor Buyer Share Edges Higher; Investor Share of Sellers Peaks

National trends
Regional trends
Investor competition was front and center for many hopeful homebuyers during the COVID-19 pandemic. Low inventory levels meant that many buyers were competing with investors for scarce inventory, and investors often won. However, the housing market has shifted significantly since the pandemic-era frenzy. Inventory levels are returning to pre-pandemic norms, home price growth has leveled out, and rents have eased. We took a look at investor activity in the U.S. housing market throughout 2024 to understand the ongoing impact of investors in a shifting housing market.
We use deed data to identify investors. The goal is to get a reading on buy-and-hold, corporate investor activity. The data does not capture mom and pop investors unless they buy using a corporate entity. We also evaluate trends in activity among small-, medium-, and large-sized investors. We also took a look at how many investors purchase with all cash and how this strategy has changed over time.
Investors pick up modest share amid low home sales in 2024
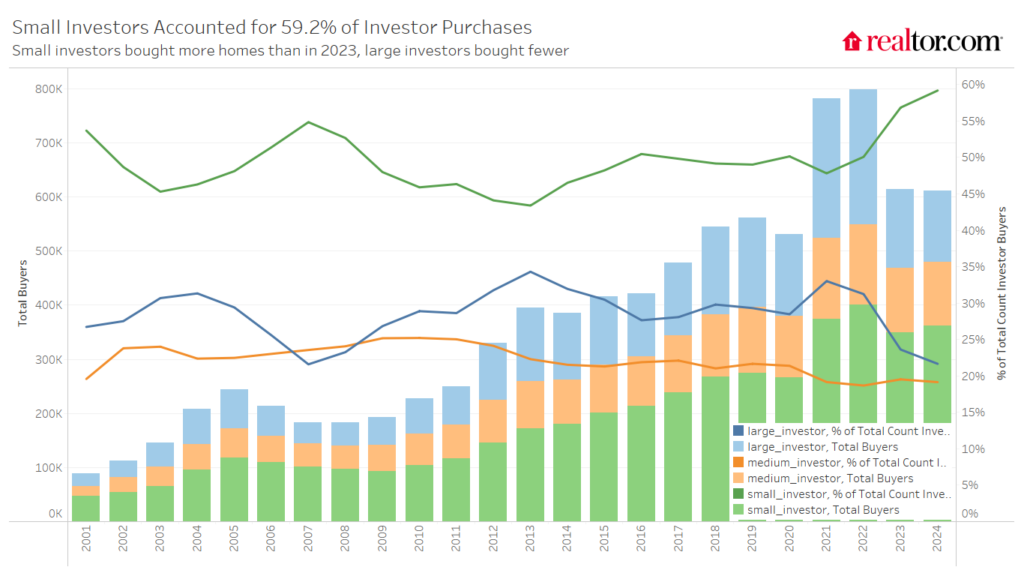
Investor purchases picked up from about 608,000 in 2023 to 610,000 in 2024. Though modest, this increase in investor home purchases came at a time when overall home purchasing slumped, resulting in an uptick in investor buyer share. In 2024, 13% of homes sold were purchased by an investor, up from 12.7% in 2023, but still below the 2022 peak of 13.3%. Home prices and mortgage rates remained elevated through the year, eating into overall buyer demand. Investor purchases picked up 0.4% in 2024, outpacing the 2.1% decline in total transactions, which dropped total home sales to a decade-plus low.

Small investors accounted for 59.2% of investor purchases in 2024, the highest small investor share in the data’s history (since 2001). Large investor activity fell to 21.7% of investor purchases, the lowest share since 2007. Small investors purchased 361,900 homes in 2024, up 3.7% year over year. Large investors purchased just 132,500 homes, down 8.7% year over year and the lowest level since 2018.
Fewer investors purchase in all cash
The share of investors who paid in all cash fell overall and for each investor size. Small investors saw the cash purchase share fall from its peak of 65.6% in 2023 to 62% in 2024, the lowest small investor cash purchase share since 2008. The large investor cash purchase share fell from 73.2% in 2023 to 68.9% in 2024, the lowest level since 2015. The 2024 housing market boasted more for-sale inventory than at any point since the beginning of the pandemic. More inventory means less competitive conditions, which likely led to fewer all-cash investor purchases.
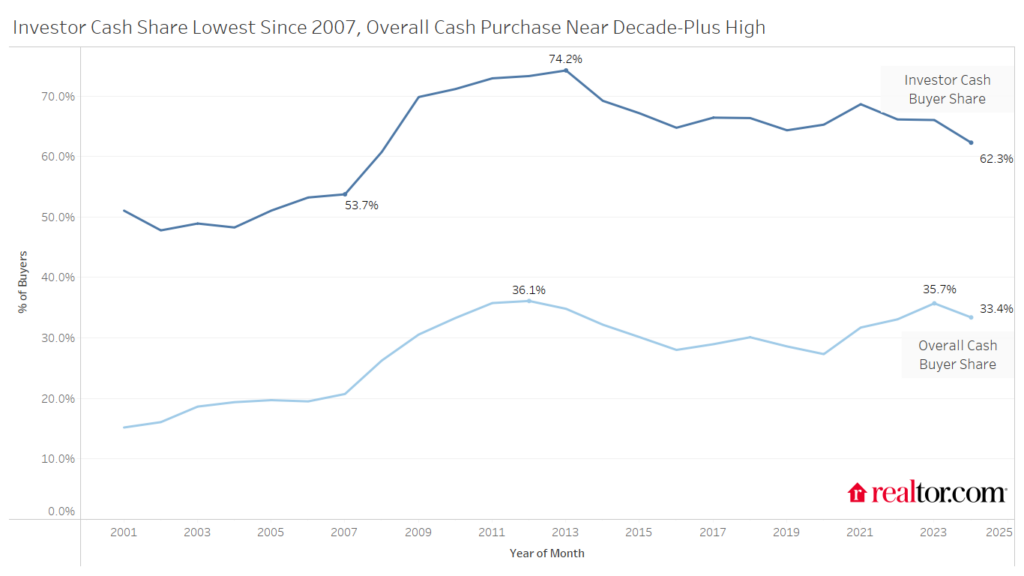
Overall, 62.3% of investors purchased in all cash, nearly double the 33.4% of all buyers to do the same. However, the investor cash purchase share was the lowest since 2008, while the overall cash purchase share was the second-highest in the past decade. These differing cash-purchase trends suggest that the high-priced housing market is drawing in owner-occupant buyers who are more financially prepared, and therefore paying in cash, while the growing share of small investors means more investors are relying on mortgages to buy property.
Investor seller activity peaks in 2024
Investor seller activity picked up in 2024, reaching a new peak of 10.8% of all homes sold in the year. In 2024, investors sold roughly 509,000 homes, fewer homes than in 2021 and 2022 when investor demand was high, but well-above pre-pandemic levels. Investor home sales picked up 5.2% year over year in 2024, outpacing the uptick in investor buyer activity. The reason behind investor sales has shifted since the pandemic’s heyday. Investors might no longer be selling to cash in on soaring home values, but rather due to market softening and easing rents.
All three investor sizes sold more homes in 2024 than in 2023, signaling a shift in the investor market. Small investors sold a total of 270,000 homes in 2024, the third highest in the data’s history, behind 2021 and 2022. On the other end of the spectrum, large investors sold 123,800 homes, higher than in 2023, but lower than in 2021 and 2022.
Though all investor sizes bought more homes than they sold in 2024, the gap was the smallest in the data’s history for large and medium investors. Large investors bought only 8,700 more homes than they sold in 2024, down from 134,000 more homes bought than sold by large investors at the peak in 2021. Medium investors bought fewer than 250 more homes than they sold in 2024, down from 25,000 more homes bought than sold by medium-sized investors in 2022.
Investor purchases still outpace sales despite improvement
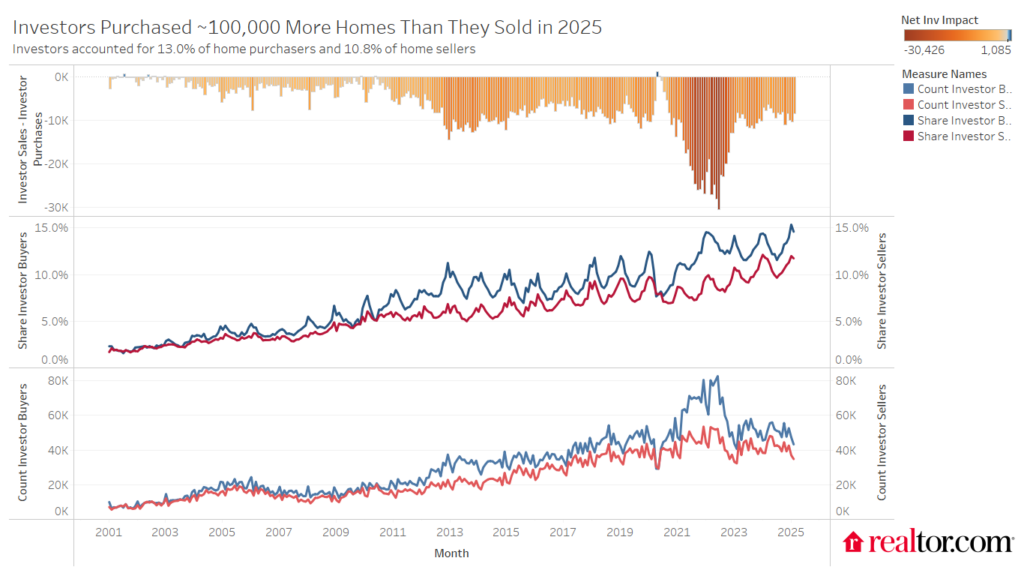
Net investor activity, defined as the number of investor sellers minus the number of investor buyers, has been negative throughout the data’s history, as more investors buy than sell each year in the U.S. However, in 2024, investor buyers bought 101,300 more homes than investors sold, the smallest gap since 2020, roughly on par with 2019. By comparison, at the peak of the pandemic market in 2022, investors bought 260,000 more homes than they sold.
The U.S. continues to grapple with the long-term effects of a housing supply shortage that spans over a decade, now estimated at nearly 4 million homes. While investors help meet rental demand, their activity can constrain for-sale inventory by competing directly with potential homebuyers. In 2024, the typical investor purchased a home for $282,000—more than $70,000 below the national median sale price. This trend highlights how investors tend to concentrate in lower-priced metros and in the lower-priced segments of the market, where homes are more likely to generate positive rental returns. As a result, budget-conscious buyers often find themselves in direct competition with investors for the most affordable properties, a contest many are unable to win.
Rental vacancy rates have climbed across the U.S. over the past year. The South and Midwest see the highest rental vacancy, while the Northeast and the West still see relatively few empty rentals. However, the South and the Midwest are both affordable and, in some parts, growing, which means some investors are strategically investing in states and metros in these regions. Where possible, investors continue to seek out relatively tight rental markets with high demand as well, especially as would-be homebuyers opt to keep renting until homebuying conditions improve.
Investors pick affordable, bustling states for investment
Investors are keenly aware of economic growth and housing demand, but they must balance home prices with potential returns. Investors bought the largest share of homes in Missouri (21.2%), Oklahoma (18.7%), Kansas (18.4%), Utah (18.0%), and Georgia (17.3%). These states are generally affordable but have seen rental prices hold up better than national rents, creating an opportunity for investors. Kansas City, which straddles the Kansas-Missouri border, saw the highest rental price growth in the country in April 2025, but it remains affordable relative to local incomes.
| State Name | 2024 Share Inv. Buyers | YoY |
| Missouri | 21.2% | 0.3% |
| Oklahoma | 18.7% | 0.2% |
| Kansas | 18.4% | 1% |
| Utah | 18% | 0.3% |
| Georgia | 17.3% | 1.2% |
| Montana | 17.2% | -0.1% |
| Mississippi | 16.7% | -1.1% |
| Wyoming | 16.3% | 0.9% |
| Indiana | 16.1% | 0.6% |
| Alabama | 15.9% | 0.8% |
In terms of investor growth, Delaware (+3.8 ppts), Ohio (+2.2 ppts), DC (+1.8 ppts), Hawaii (+1.4 ppts), and Nevada (+1.3 ppts) saw the investor share pick up the most year over year in 2024. Delaware, Ohio, and DC continue to face scarce inventory conditions, which keeps upward pressure on home prices and could sway would-be buyers to continue renting. Investors can take advantage of the high demand in these markets, especially as home prices in Ohio and Delaware tend to be lower than in other nearby markets. The recent Wall Street Journal/Realtor.com Housing Market Ranking placed Toledo, OH, as the top market, and reporting showed that investors played a large and growing role in that market.
To know more, click here.
By: Hannah JonesI Realtor.com I June 10, 2025